 A study measuring the cross-device behaviour of nearly 5,000 UK adults reveals which sectors are most dominated by the different devices in terms of the time people spend visiting them.
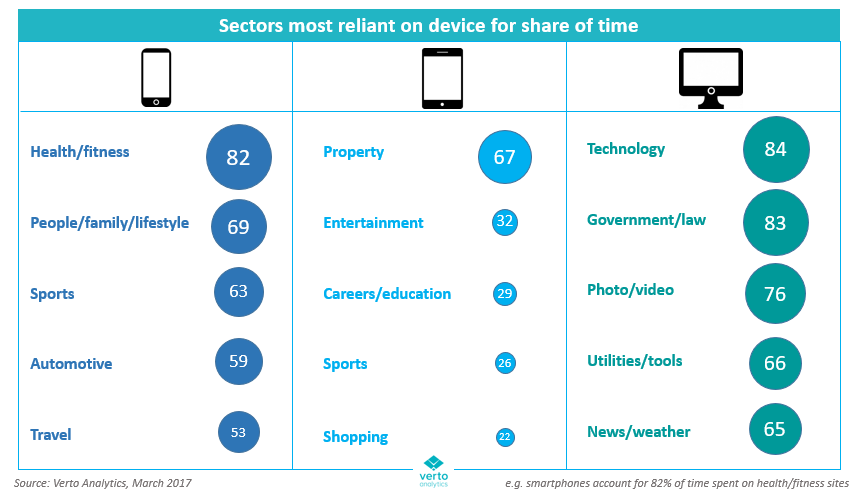
The Verto Analytics study shows that the health/fitness sector – such as Fitbit and the NHS – is the most dominated by smartphone usage. Smartphones account for 82% of the time people spend visiting health/fitness sites and apps. People/family/lifestyle sites – such as Netmums and BBC Good Food – are the next most dominated by smartphone usage (69%) followed by sports (63%).
In contrast, property – such as Rightmove and Zoopla – is the only sector dominated by tablet usage: tablets account for 67% of the time people spend on property sites. Technology (84%) – such as telecom brands Virgin and BT – and government/law sites (83%) are the most reliant on PC usage.
“Media owners and advertisers must adapt their offering or behaviour to more accurately reflect how people are most likely to be visiting them,” says Dr. Hannu Verkasalo, Verto Analytics’ CEO. “Is the rush to embrace mobile, for example, right for you? Clearly it is for the likes of health, lifestyle and sports – while property seems absolutely made for tablets – but certainly not for government, law and telecoms sites. People still prefer to use PCs for these as it remains dominant for functional, practical type behaviour.”
Verkasalo points out that the news/weather sector “in particular, should take heed” of how their users access their content and not necessarily rush to target mobile, “publishers shouldn’t overlook that desktop still accounts for 65% of the time people spend here, while mobile accounts for just 19%.”

Entertainment, shopping and books least dominated by one device
In contrast, the entertainment sector – including the likes of YouTube, Netflix and Spotify – is the least dominated by any one device type, having the most even split in how people spend their time across the different devices: smartphones account for 39% of entertainment time, not too far ahead of tablets (32%) and PCs (29%).
Alongside entertainment, the shopping and books sectors are the most likely to have a fairly even split between the time spent on different devices, which Verkasalo notes means these sectors are the most likely to “have their work cut out in perfecting their output across all devices, as opposed to those who can more afford to put their eggs in one basket.”
Source: Verto Analytics

You must be logged in to post a comment Login